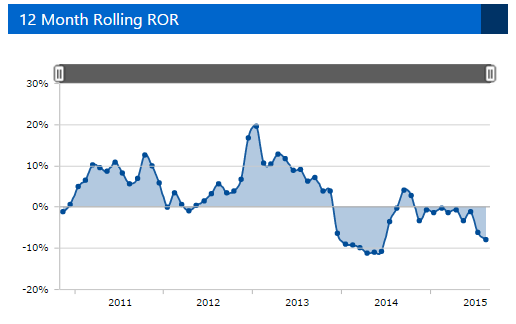
The volatility chart is based on the standard deviation calculation (see the Standard deviation definition) and shows how the volatility of returns changes through the programs/portfolio trading history.
12 months rolling volatility means that we calculate standard deviation using the 12 month rolling periods of returns and we get a specific standard deviation value for each period.