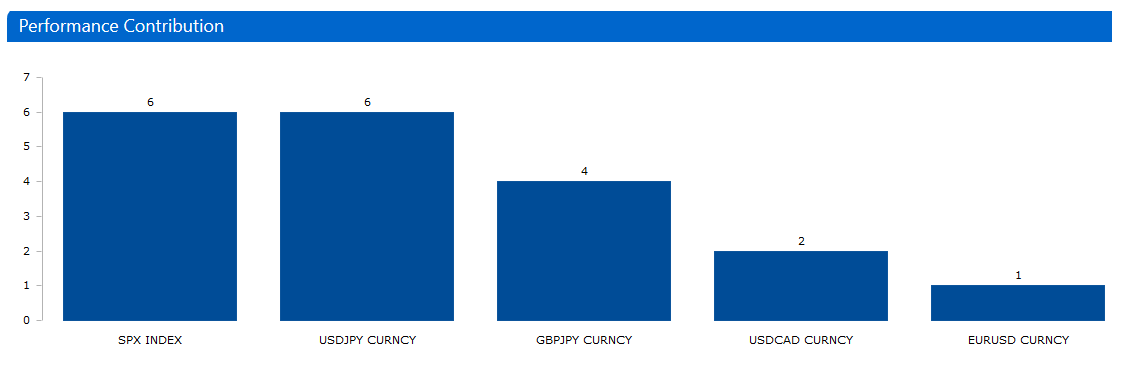
The chart shows how contribution forms the foundation of attribution and allows us to evaluate how shares in a factsheet contributed to the overall profit or loss in any reporting period.
The chart is available as a pie chart, donut chart or a bar chart.
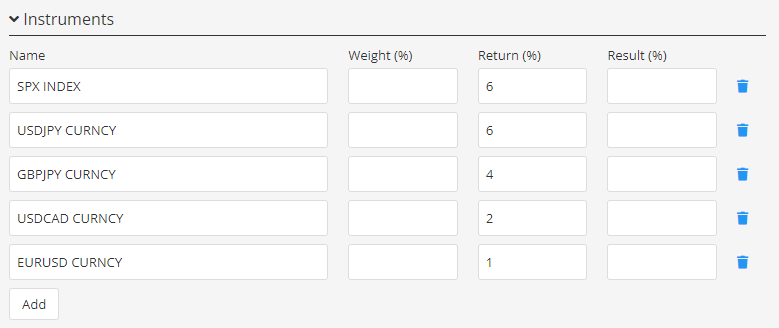
Values can be entered under Portfolio Composition / Instruments – Return Contribution (see screen below)