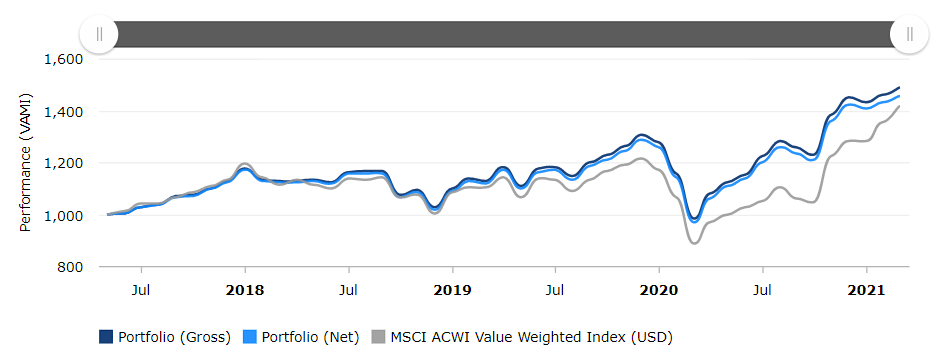
Regulations may require you to display net and gross data in a single factsheet. In our fund factsheets you can use both tables and charts to do this.
Example 1: Monthly Performance table
You can add a second Monthly Performance table to your factsheet template so there will be one table for gross returns and another for net performance data.
Another option is to display two different data series in one table which will save you some space in your factsheet.
Example 2: VAMI chart
You can create a new program with gross or net data and then use it as a benchmark.