The aggregate amount an investment has gained or lost over time. Presented as a percentage.
- The chart can be calculated on a daily/monthly/quarterly basis.
- It’s possible to hide data for the first month, see below.
- This chart can be found for example on our Global Alpha template.
Hiding the first month
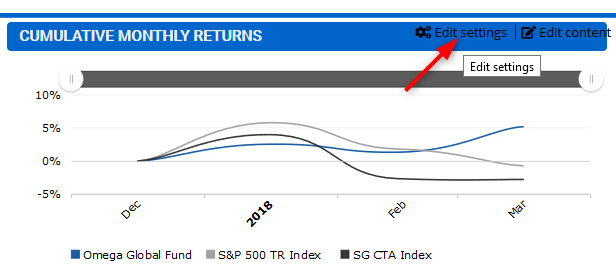
1. Mouse-over the chart and click “edit settings” link.
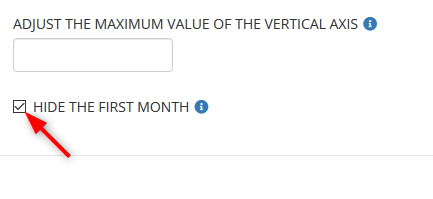
2. In the pop-up window, tick the “Hide the first month” checkbox and save settings.
Annul reset
It is possible to add a new line to the graph which will show the annual development.
1. Click on Edit settings (you can see on picture above)
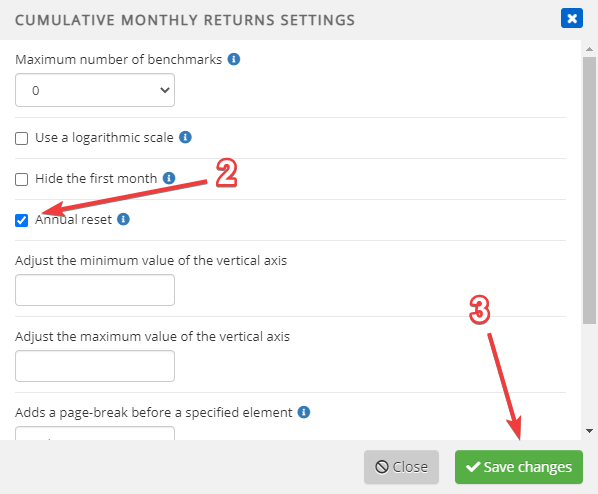
2. Check Annual reset checkbox
3. Save settings